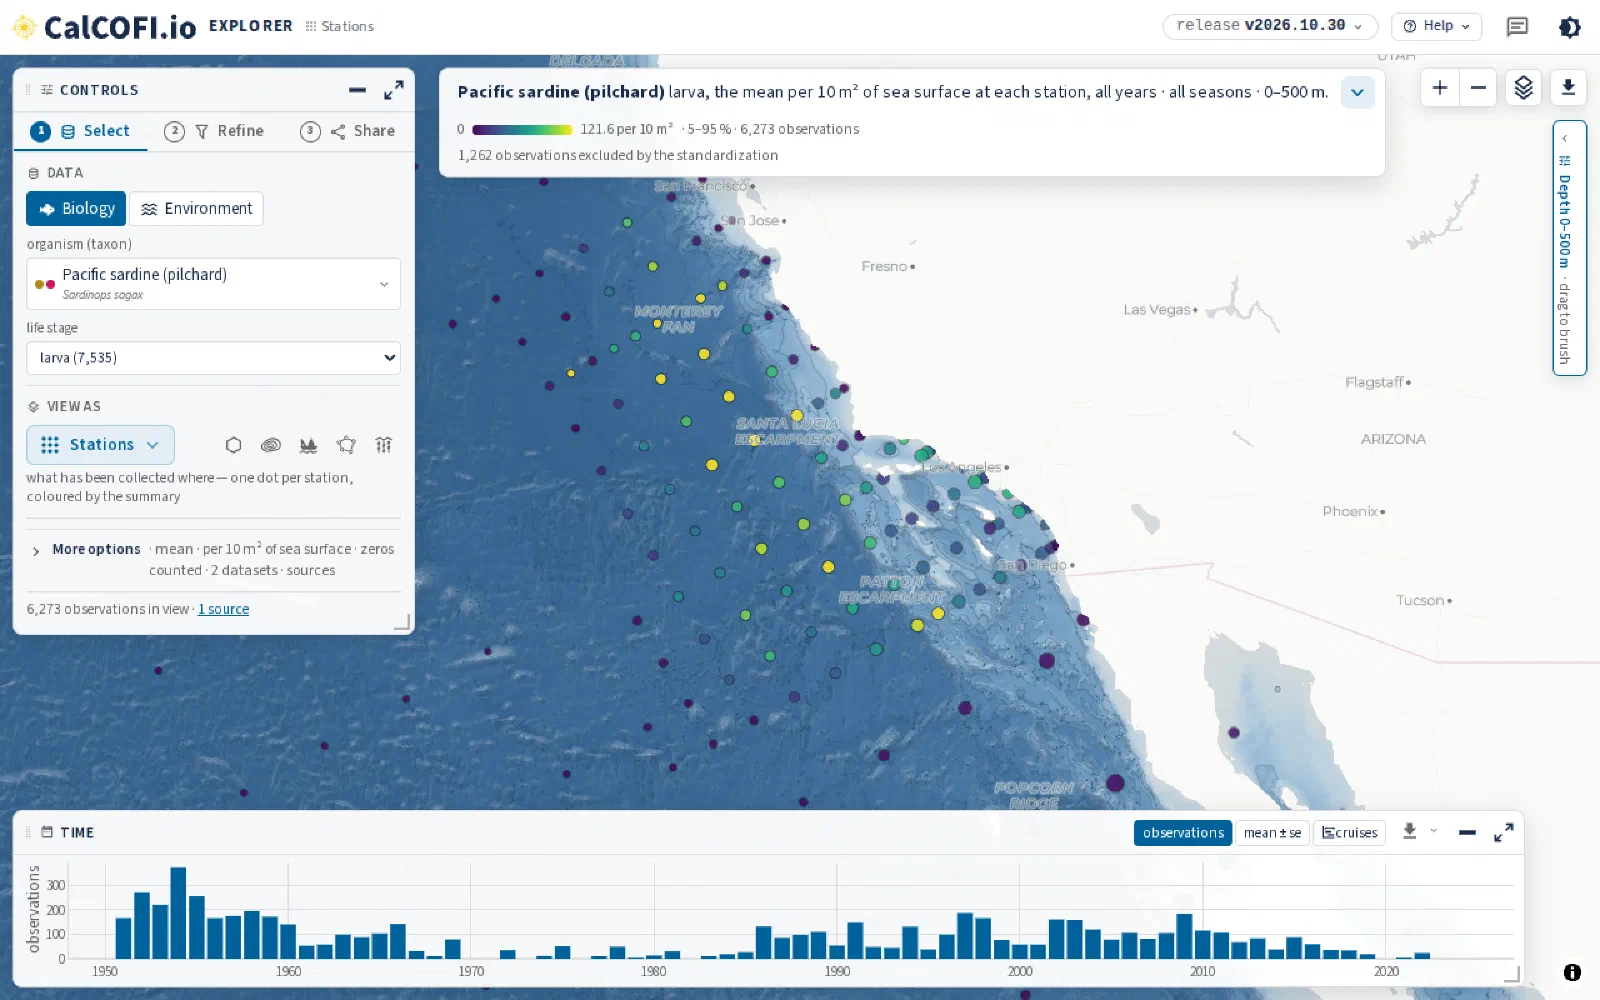
CalCOFI Explorer is the front door to the integrated database. Pick a dataset (ichthyoplankton taxa, bottle chemistry, CTD variables) and switch between lenses that each answer a different question: where was it sampled (stations), how does it vary across the grid (hexagons, contours), how has it changed by cruise (cruises), how do regions compare (regions), and what does the water column look like along a line (sections).
Every query runs in the browser against the release Parquet files with DuckDB-WASM, so there is no app server to scale or keep alive. Maps are drawn with MapLibre and deck.gl; plots with Plotly. The app supersedes the earlier Shiny explorers (Hexagon, Cruise and Contour) and shares its section-drawing conventions with CTD Transects.