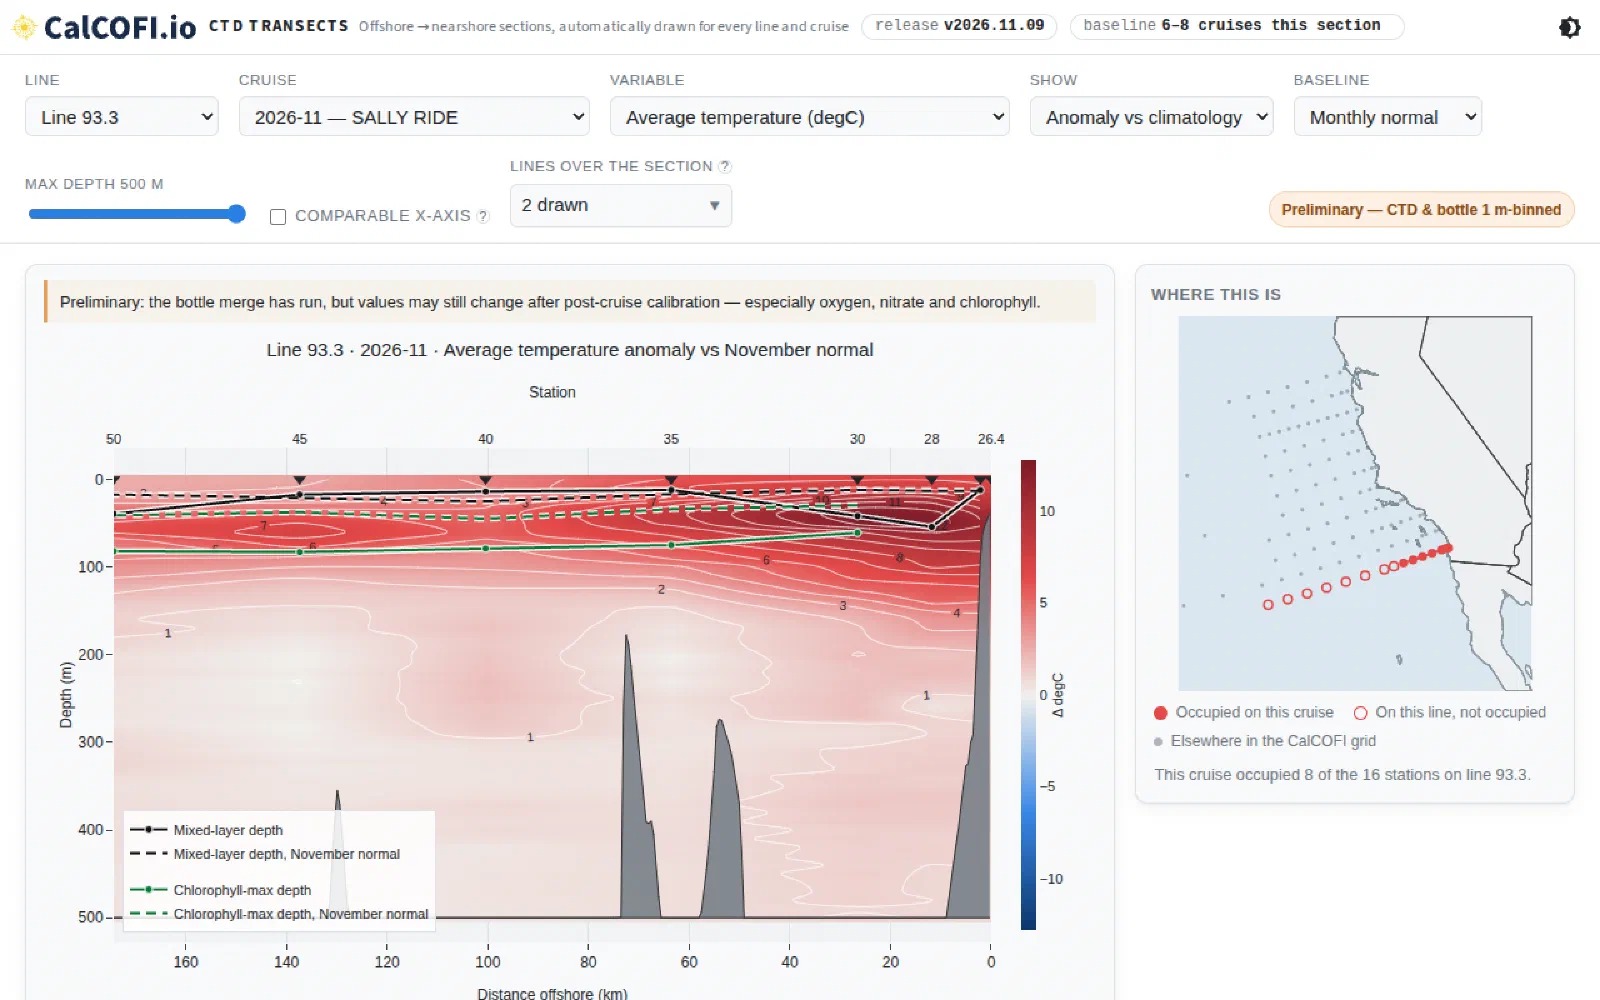
A focused, one-dataset view of the CTD record. Choose a line and cruise and the app draws the classic cross-shelf section — offshore on the left, station and distance rulers along the top — for each measured variable, with a climatology-based anomaly view as the default so unusual water stands out immediately.
Sections are prebuilt as static JSON and served from GitHub Pages, so the app is fast and dependency-free. It shares its drawing conventions and climatology table with the Sections lens of CalCOFI Explorer.